The USDJPY currency pair recently experienced notable fluctuations triggered by the Bank of Japan’s (BoJ) anticipated rate hike. Market expectations were set for a modest increase of 25 basis points, which in itself initiated a temporary dip. However, this decline proved to be short-lived, highlighting the broader resilience of the dollar amidst a shifting interest landscape.
The BoJ’s decision to raise its interest rates to their highest level in 17 years created initial volatility in the USDJPY market. Despite this adjustment, the subsequent recovery—approximately 100 pips—indicates solid support for the dollar. This resilience can largely be attributed to the significant gap between the monetary policies of the U.S. Federal Reserve and the BoJ, which has led to distinct expectations about future currency movements.
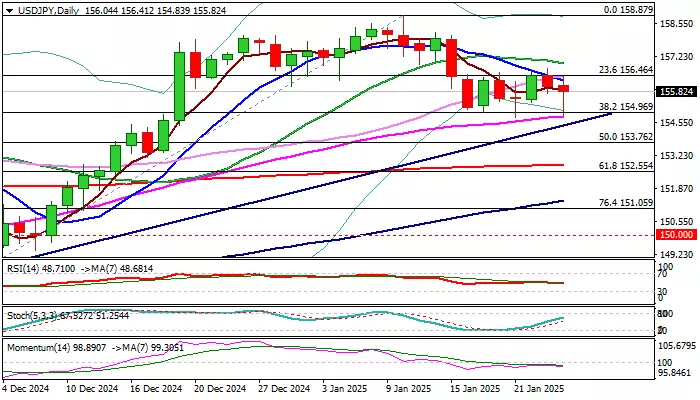
Technical Analysis: Key Levels and Patterns
In the realm of technical analysis, the USDJPY pair is currently testing critical Fibonacci support at 154.97, which corresponds to the 38.2% retracement of the price range between 148.64 and 158.87. This level is further reinforced by the proximity of the 55-day moving average (DMA) and trendline support. The repeated failures to break through this pivotal support zone signal a lack of downward momentum, suggesting that market participants remain cautious about initiating heavier selling.
Moreover, the persistence of sideways movement—seen over seven consecutive days—indicates indecision in market sentiment. Although the BoJ’s rate hike did not incite a sharper drop, the lack of a clear directional signal leaves traders observing closely for indications of future movement.
On the daily chart, a bear trap pattern has begun to emerge. This formation creates a scenario where the price appears to be reversing downward but then consolidates at higher levels, potentially leading to bullish outcomes. However, confirmation of this pattern is crucial. A close above the defined resistance levels—specifically the range top at 156.75 and the 20 DMA at 156.94—would signal a stronger bullish trend and the completion of a higher base.
Conversely, from a bearish perspective, a decisive break below the Fibonacci support zone (154.97/50 zone) could trigger negative signals. This potential outcome could indicate a retracement from the multi-month peak of 157.87, delineating a significant shift in market sentiment.
Overall, the technical studies available suggest a mixed market outlook, with neither a comprehensive bullish nor bearish signal prevailing at present. However, the overarching trend remains bullish, suggesting that while some correction may be plausible, it might precede a renewed push higher. As market participants continue to navigate the potential impacts of monetary policy decisions and market behavior, the USDJPY remains a focal point of attention in the evolving financial landscape.